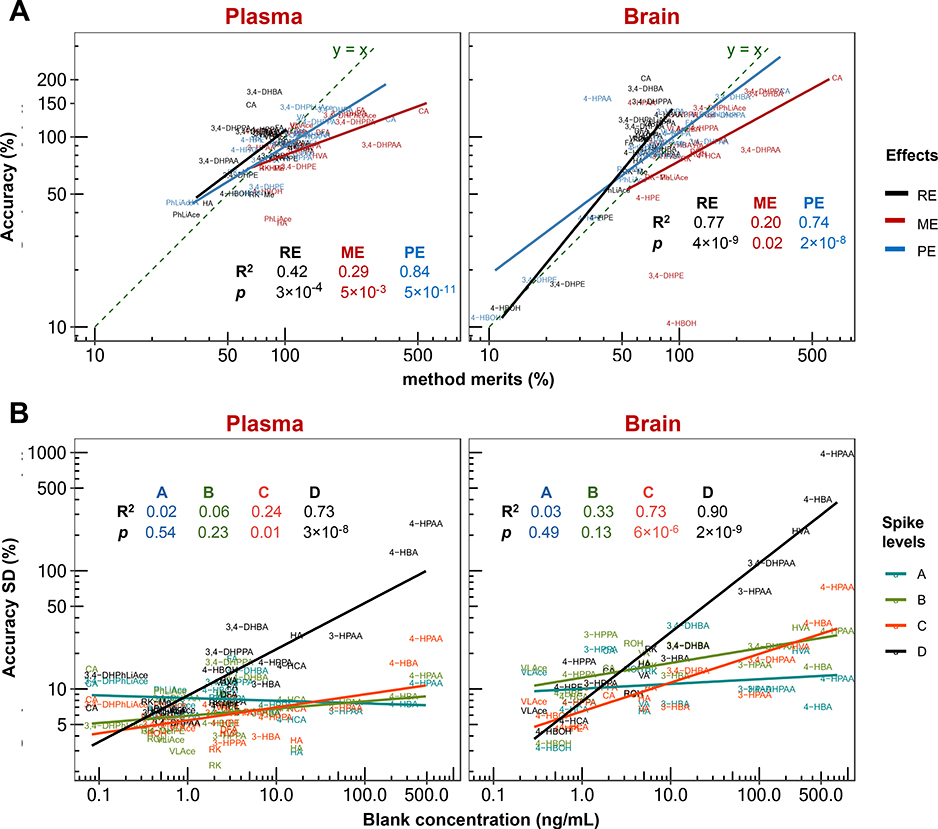
Fig. 6.
Correlation analysis of validated accuracy mean value and standard deviation (SD) with recovery (RE), matrix effect (ME) and processing efficiency (PE) (A), and with endogenous or background concentration in the biomatrices (B). In plot (A), accuracy was averaged across three spike levels of A, B and C (D the lowest level was not counted due to high susceptibility to background interference), and RE, ME and PE were respectively averaged across two levels of B and C. In both plots (A) and (B), linear regression statistics were calculated based on base-10 logarithmically transformed data.

