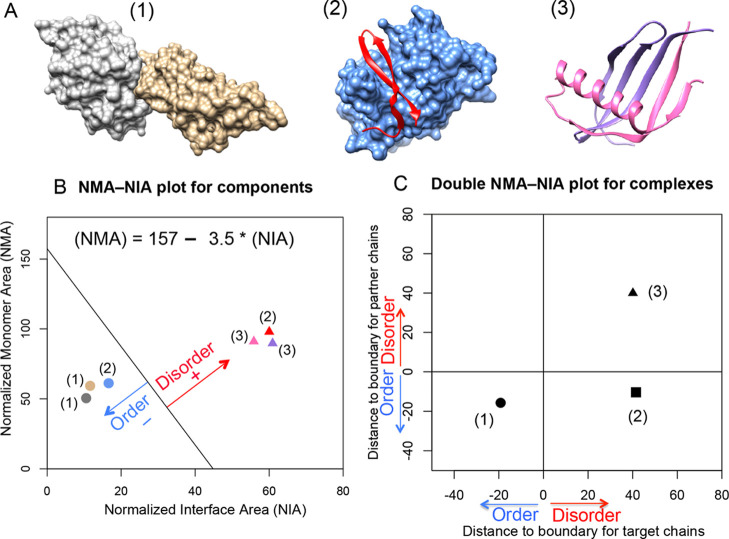
Figure 1.
Disorder and order prediction based on complex structures using NMA–NIA analysis. (A) Three different types of complexes containing (1) two ordered proteins, (2) one disordered protein and one ordered protein, and (3) two disordered proteins. Their PDB ids are: 2I26, 3IXS, and 1KRL, respectively. (B) Normalized monomer area and interface area (NMA–NIA) of components in each complex. Disordered and ordered components are represented using triangles and circles, respectively. The components are colored as same as the structures presented in (A). The distance of each component to the linear boundary was calculated. The equation for the boundary ((NMA) = 157 – 3.5 × (NIA)) was determined in the reference23 as mentioned in the Methods section. Disordered components were defined as having positive distances, and ordered components were defined as having negative distances. (C) Double NMA–NIA plot is generated by plotting the distances for each member of an interacting pair. The values for chains of interest (target chains) are designated as x-axis, and the values for binding partners as designated as y-axis. The combination of positive or negative values for components will lead to distinct locations of different complexes in the plot.

