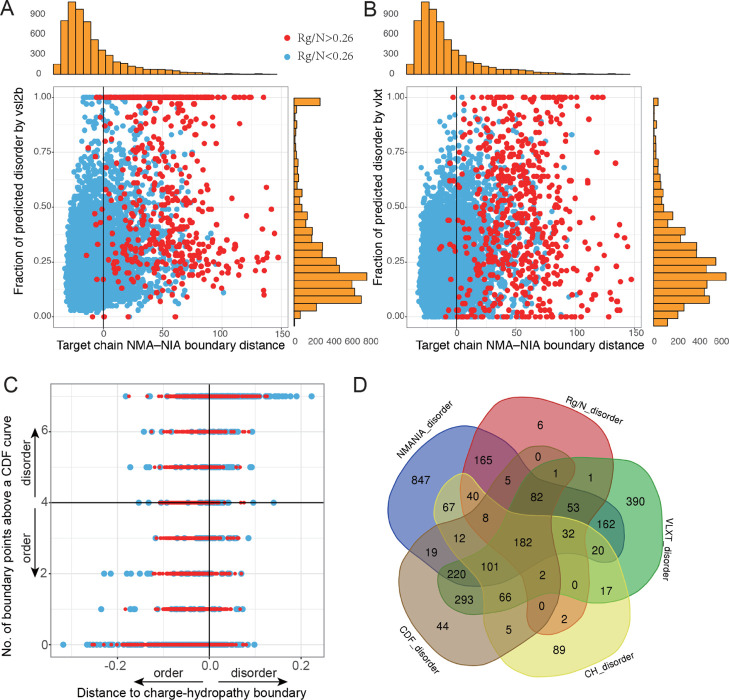
Figure 2.
Comparison of disorder/order predictions by six different methods. (A) Comparison of NMA–NIA boundary distances, Rg/N, and VSL2b. (B) Comparison of NMA–NIA boundary distances, Rg/N, and VLXT. Red points: proteins with Rg/N higher than 0.26 (prediction of disorder). Blue points: proteins with Rg/N lower than 0.26 (prediction of order). Vertical marginal histograms (orange) are the distribution of the disorder prediction by VSL2b (A) and by VLXT (B), respectively. Horizontal marginal histograms shown in the figure are the distribution of NMA–NIA boundary distances for the target chains. (C) Comparison of two binary classification of disorder and order with Rg/N. The indications of colored points are the same as (A,B). (D) Numbers of the predicted disordered chains by different approaches. The cutoffs for each method are: NMANIA_disorder: NMA–NIA boundary distance >0; Rg/N_disorder: Rg/N > 0.26; VLXT_disorder: fraction of predicted disordered residues >0.35 (this threshold was proposed in ref (27) but needs further investigation). CH_disorder: distance to the charge-hydropathy boundary >0; CDF_disorder: numbers of CDF points ≥4.

