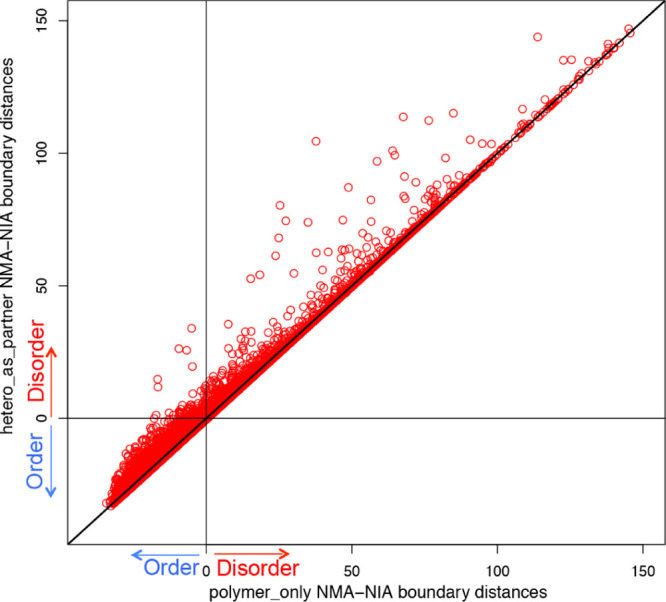
Figure 3.

Changes of NMA–NIA boundary distances between polymer_only and hetero_as_partner. Each point represents a PDB chain. The x-axis indicates the NMA–NIA boundary distances for target chains considering protein/DNA/RNA only (polymer_only). The y-axis indicates the NMA–NIA boundary distances for target chains considering hetero groups as partner (hetero_as_partner). The chains located on the diagonal line are those without distance changes, which means their heterogroup binding does not induce the disorder/order transition of these protein chains. All the other points (>1/3) showed distance changes, suggesting that the heterogroup binding contributes to the disorder/order transition. Particularly, the points in the upper left quadrant changed from prediction of order (x-axis < 0) to prediction of disorder (y-axis > 0), when considering heterogroups as binding partners. This means that for these (totally 145 chains), heterogroup binding is likely to induce them undergo order-to-disorder transition.
