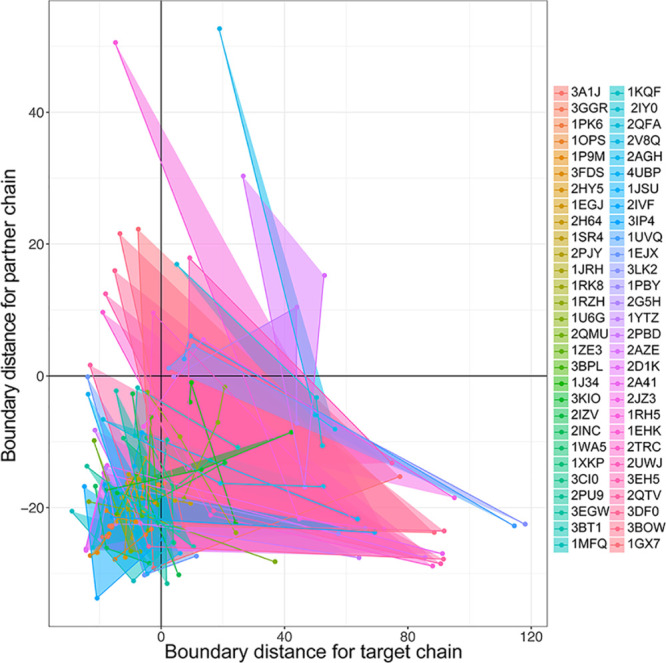
Figure 4.

Converting triad binding into binary interactions by NMA–NIA boundary distances. These three different chain complexes are represented as triangles in the plot because each chain in these complexes is alternatively taken as the one-component target and the remaining two chains are taken as partners. The x-axis and y-axis are the NMA–NIA boundary distances for the one-component target chains and two-component partner chains, respectively. The figure legend on the right indicates the PDB ids of these complexes.
