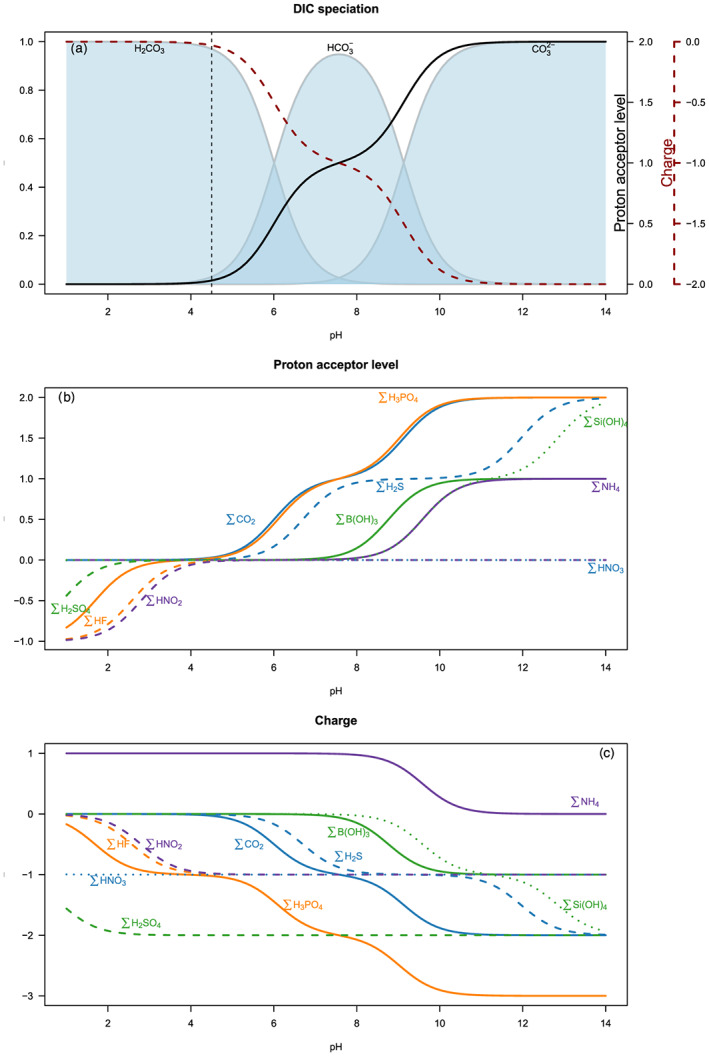
Figure 1.

Speciation, proton acceptor levels, and charge as a function of pH. (a) Bjerrum plot showing the distribution of carbonic acid, bicarbonate, and carbonate as a function of pH and the corresponding proton acceptor level (solid black line) and charge (red dashed line); (b) the proton acceptor level for selected acid–base pairs; (c) the charge for selected acid–base pairs. Details of the calculations are presented in the supporting information.
