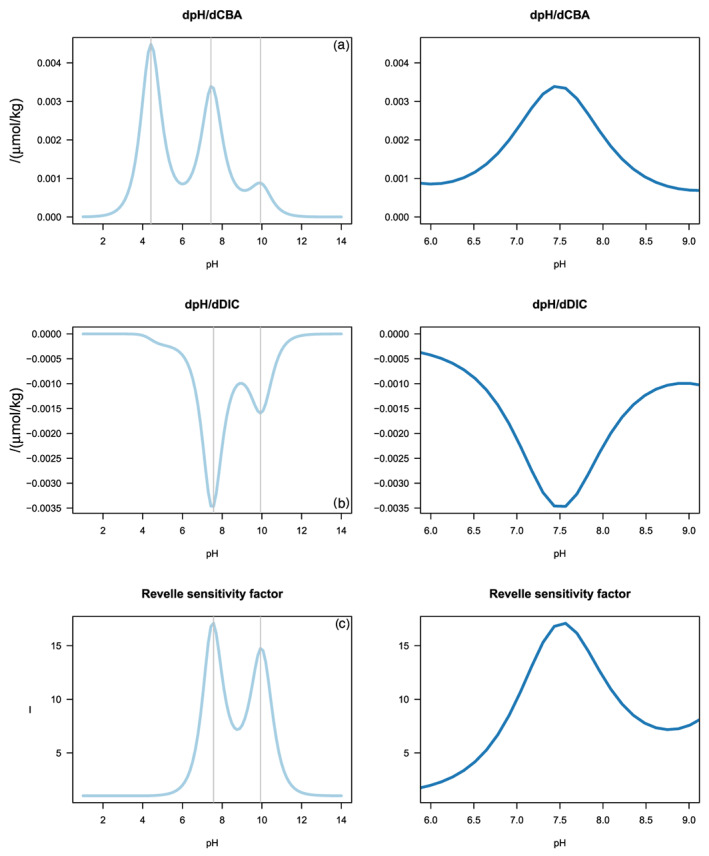
Figure 2.

The sensitivities dpH/dCBA (a), dpH/dDIC (b), and the Revelle sensitivity factor (c) as function of pH. Left column over the entire pH range; right column focuses on the changes from pH 6 to 9. Vertical gray lines indicate maxima/minima. Details of the calculations are presented in the supporting information.
