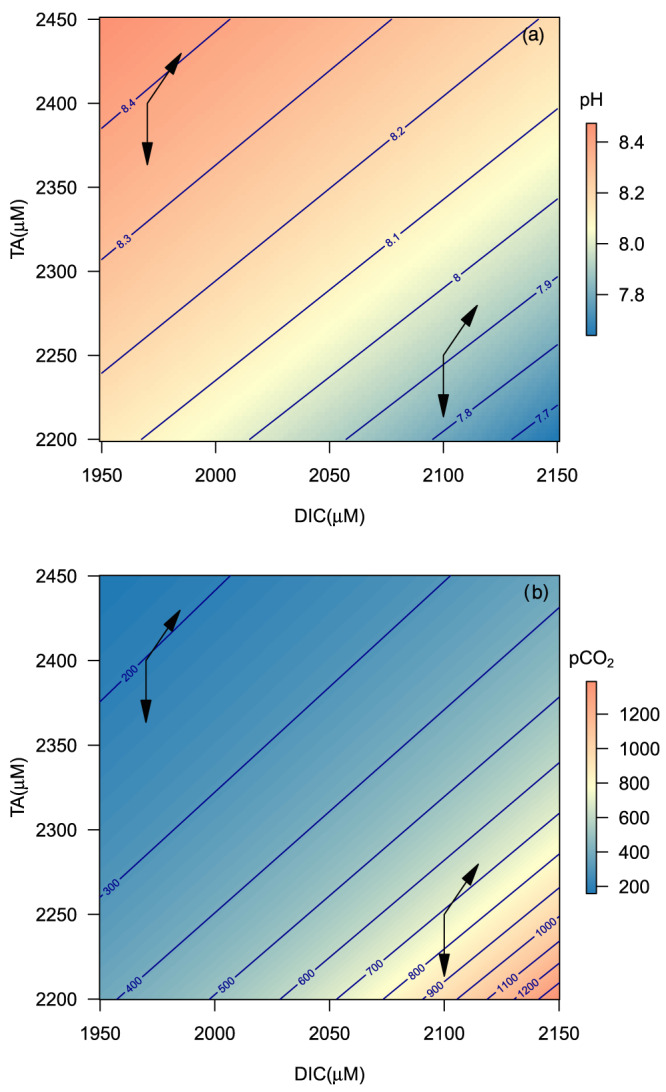
Figure 3.

TA versus DIC plots (i.e., Deffeyes diagrams) showing the equilibrium pH at free scale (a) and pCO2 in μatm (b) as contours. Both graphs show vectors for the addition of protons (vertically downward) and dissolution of calcium carbonate (slope 2:1). Notice that the resulting change in pH and pCO2 for the same amount of calcite dissolved or acid added (same vector) differs because of differences in sensitivity (buffering). For instance, the ΔpH and ΔpCO2 for proton additions are −0.074 and +136 μatm, respectively, at low buffering (high DIC/TA ratio), and −0.037 and +20.9 μatm at high buffering (low DIC/TA ratio). Similarly, for the calcite dissolution vector, the ΔpH values are 0.022 and 0.013 and the ΔpCO2 values are −33.9 and −5.9 μatm for low and high buffering, respectively.
