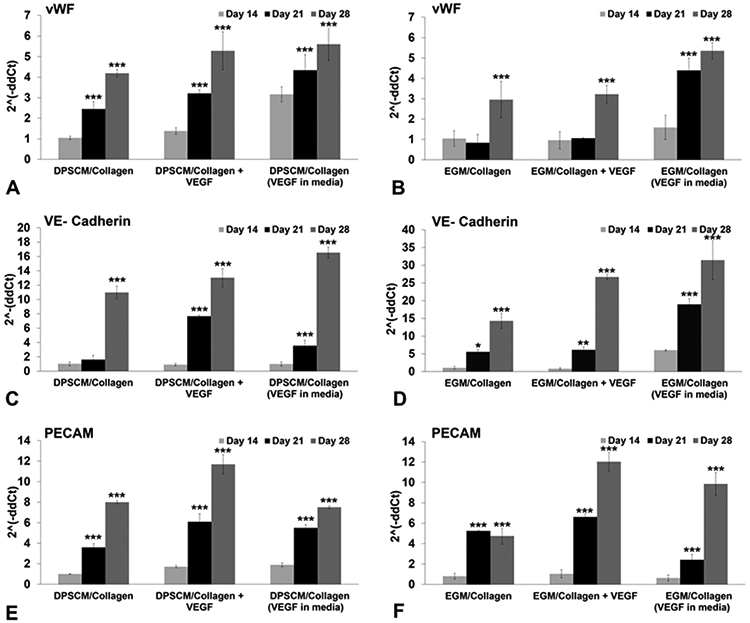
Figure 6.

Endothelial differentiation on collagen (235 Pa) matrices. Real-time PCR data (CFX96, Bio-Rad) showing expression levels of endothelial cell markers in DPSCs encapsulated in 235 Pa collagen matrices on Days 14, 21, and 28: (a) vWF–DPSCM, (b) vWF–EGM, (c) VE-Cadherin–DPSCM, (d) VE-Cadherin–EGM, (e) PECAM–DPSCM, and (f) PECAM–EGM. Relative expression of target genes was performed using the 2−ΔΔCt method. The results were normalized against the expression of glyceraldehyde-3-phosphate dehydrogenase (GAPDH). Statistical analysis was performed to compare matrices on Days 21 and 28 to Day 14. Values represent the mean ± SD (n = 3). [Statistical difference designations: (***) p < 0.001, (**) p < 0.01, and (*) p < 0.05.]
