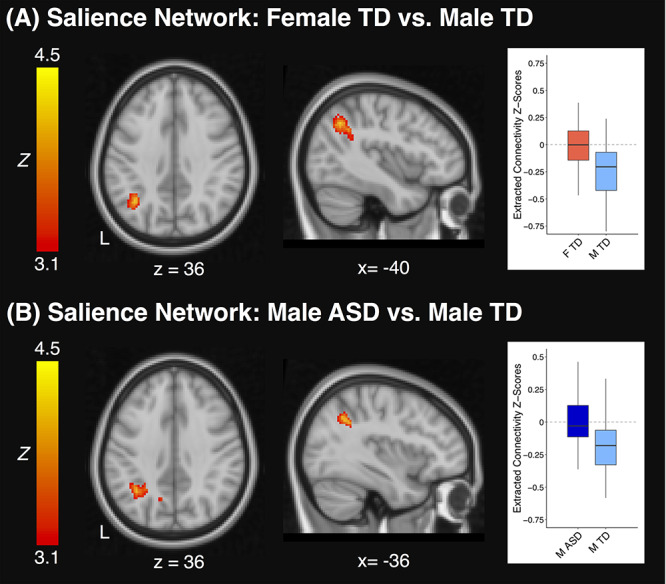
Figure 1.

Clusters that displayed a significant difference in salience network functional connectivity between TD girls and boys (A) or between boys with ASD and TD boys (B). Connectivity z-scores extracted from each significant cluster are represented at right, with boxplots displaying the median and interquartile range of connectivity z-scores and whiskers representing the most extreme z-scores within 1.5 times the interquartile range. ASD: Autism Spectrum Disorder; TD: Typically Developing; F: Female; M: Male; L: Left.
