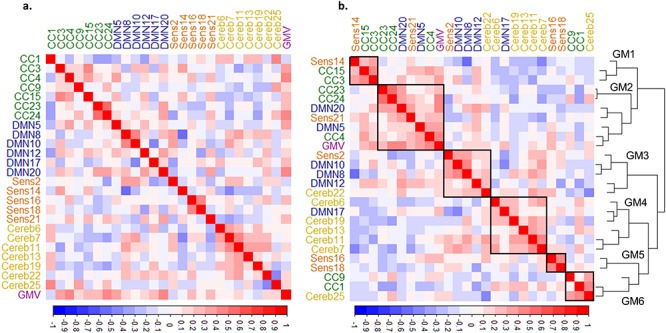
Figure 2.

Genetic overlap between SBM networks and GMV. (a) Plot shows genetic correlations between each pair of SBM networks ordered and color coded by functional module. (b) The same as a but ordered by agglomerative hierarchical clustering; lines represent the clustering dendrogram. The clustering algorithm identified six genetic modules (GM) outlined by the black squares and numbered in the dendrogram. CC, cognitive control; DMN, default mode; Sens, sensory; Cereb, cerebellar; GMV, gray matter volume.
