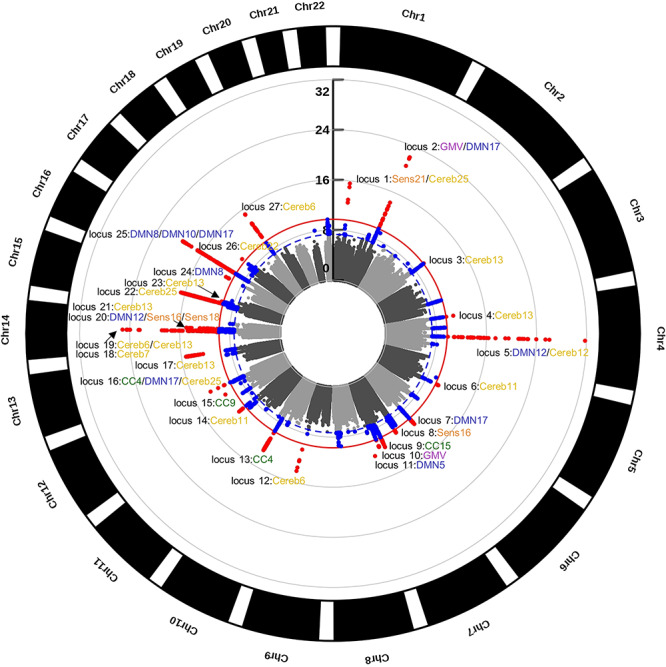
Figure 3.

GWA analyses results. Circular Manhattan plot of all GWA analyses (n = 26). Blue dots are variants exceeding the nominal GWA significance threshold (blue dashed line; P < 5.0 × 10⁻⁸); red dots are variants exceeding the Bonferroni corrected threshold (solid red line; P < 1.96 × 10⁻¹⁰). Locus peaks are labeled with their respective SBM networks. Some loci were identical for multiple networks, whereas other loci had overlapping windows (particularly in chromosomes 14 and 16). The GWA analyses identified 27 unique loci across 18 SBM networks and GMV. Scale is in log10. CC, cognitive control; DMN, default mode; Sens, sensory; Cereb, cerebellar; GMV, gray matter volume; Chr, chromosome.
