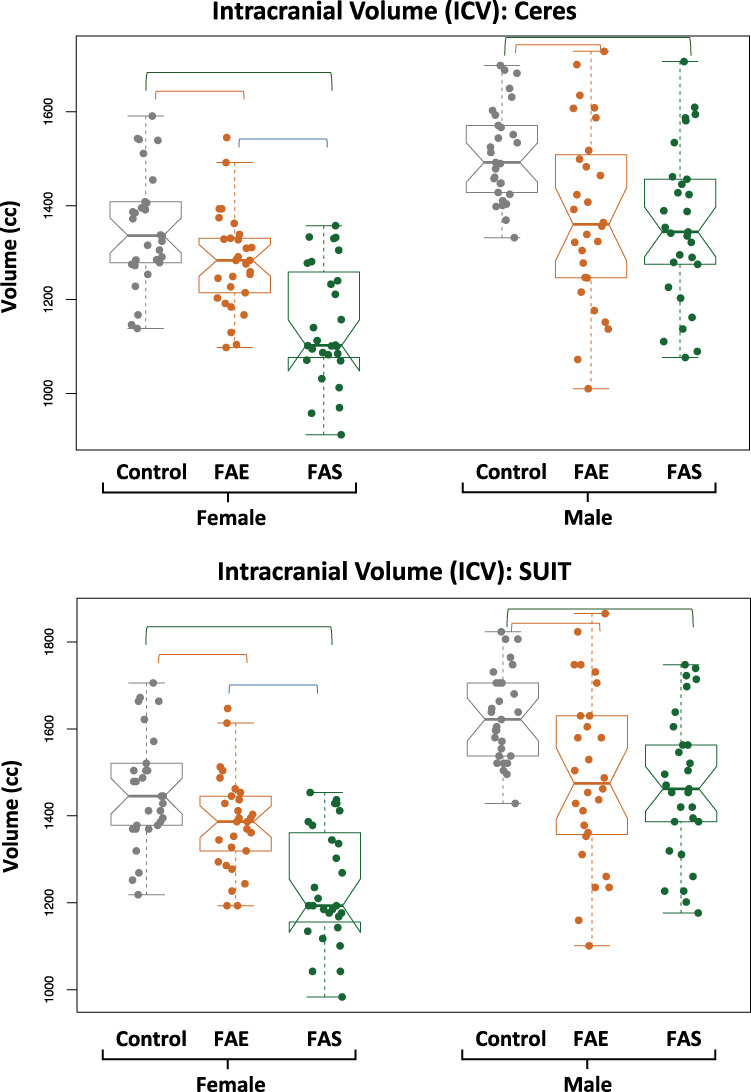
Figure 1.

Violin plots of the ICV measured with Ceres (top) and with the SRI24 atlas used for the SUIT analysis (bottom) for each group by sex. Both analysis approaches identified graded effects, such that the ICVs of the controls were the largest, the FAS were the smallest, and the FAE fell between the extremes. Further, the female groups were smaller than the male groups. The overlying bars indicate significant differences, as noted in Table 2.
