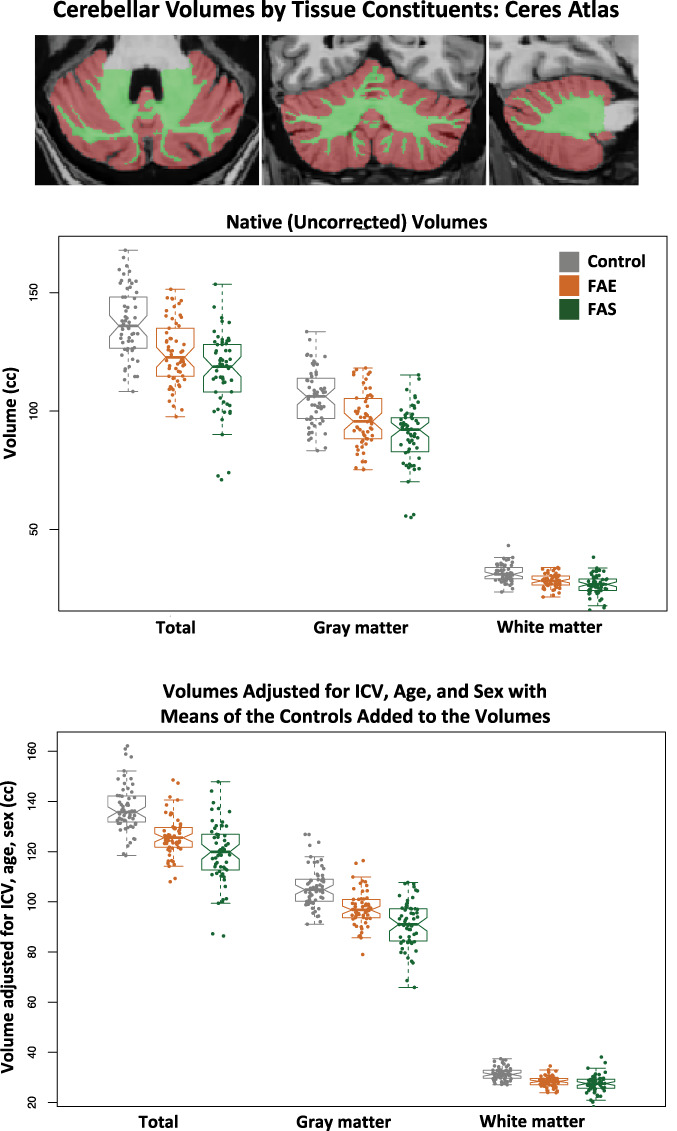
Figure 2.

Top MRI example: axial, coronal, and sagittal slices of the cerebellum segmented using the Ceres atlas; brown = gray matter, green = white matter. Data plots: Violin plots of the total, gray matter, and white matter cerebellar volumes for the three groups. The top data are native (uncorrected) volumes, and the bottom data are volumes adjusted for ICV, age, and sex with the means of the controls added to the volumes for display. In general, each measure showed a graded effect: control > FAE > FAS. See Table 3 for statistics.
