
Figure 3.
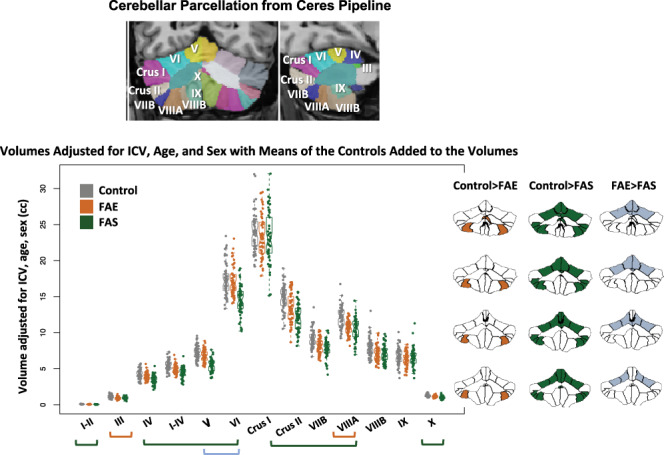
Top MRI example: coronal and sagittal views of the cerebellum parcellated using the Ceres atlas and pipeline. Data plot: Violin plots display volumes adjusted for ICV, age, and sex with the means of the controls added to the volumes for display. The greatest differences were between the control and FAS groups (green bars and green fills in the parcellated examples); additional differences were identified between controls and FAE (orange bar and orange fills in the parcellated examples); a few lobules were significantly smaller in the FAS than FAE group (blue bars and blue fills in the parcellated examples). See Table 3 for statistics.