
Figure 4.
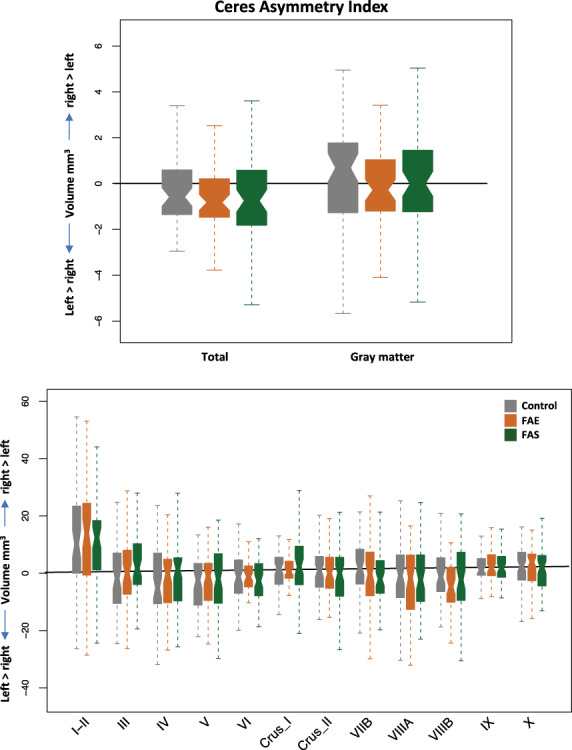
Asymmetry measures produced by the Ceres pipeline of total (top) and lobular (bottom) volumes by group.
Official websites use .gov
A
.gov website belongs to an official
government organization in the United States.
Secure .gov websites use HTTPS
A lock (
) or https:// means you've safely
connected to the .gov website. Share sensitive
information only on official, secure websites.
Asymmetry measures produced by the Ceres pipeline of total (top) and lobular (bottom) volumes by group.