
Figure 2.
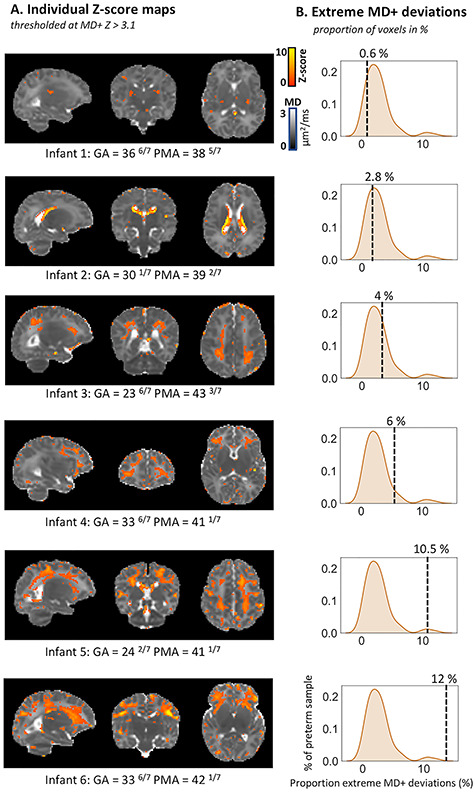
Detecting deviations from normative development at the level of the individual preterm infant. Individual MD+ deviations (Z-score maps thresholded at Z > 3.1) are shown for six preterm infants depicting the unique spatial patterns observed within the preterm sample (A). The density plots (B) indicate where is the overall brain proportion of extreme deviations for this infant in relation to the rest of the preterm sample. Infants were selected to show different overall proportions of extreme deviations. Infant 1 had a relatively low atypicality index (0.6% of voxels), while infant 6 had a relatively high index (12%) of voxels deviating from the model. The GA at birth and PMA at scan (in weeks +days) are also shown for each infant.