
Figure 3.
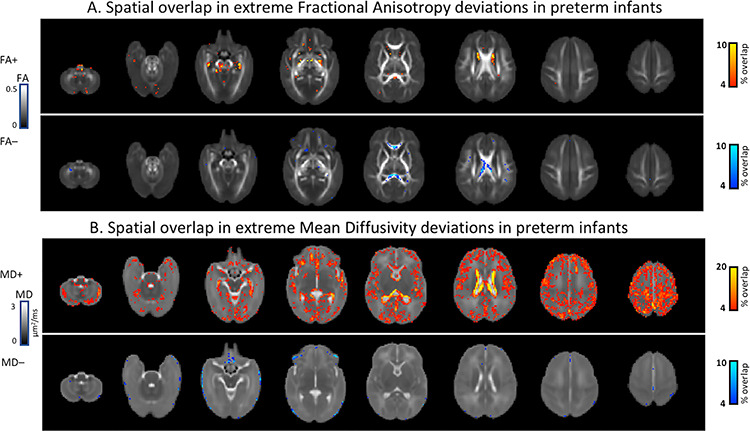
Percentage spatial overlap of extreme deviations across the developing preterm and term brain imaged at term-equivalent age. Spatial overlap in fractional anisotropy (A) and mean diffusivity (B) maps depicting areas of the brain where more than 4% of the preterm sample or more than three infants have extreme deviations from the model mean given their age and sex.