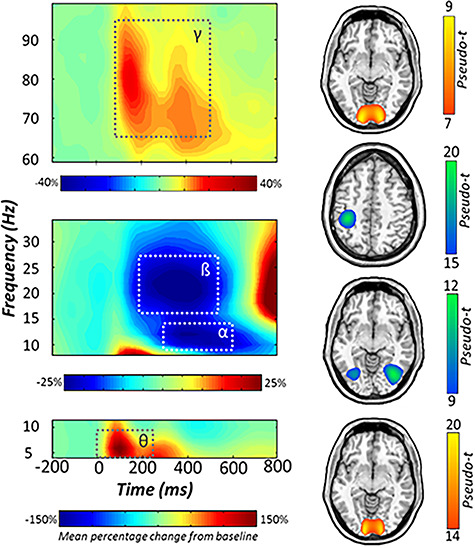
Figure 3.

Neural responses to the visuospatial task. (Left): Grand-averaged time–frequency spectrograms of MEG sensors exhibiting one or more significant responses, with gamma activity at the top, alpha and beta below, and theta at the bottom. In each spectrogram, time (ms) is denoted on the x-axis and frequency (Hz) is shown on the y-axis. All signal power data are expressed as percent difference from baseline, with color legends shown below each respective spectrogram. Dashed lines indicate the time–frequency windows that were subjected to beamforming. (Right): Grand-averaged beamformer images (pseudo-t) across all participants and ME-tDCS montages for each time–frequency component. Axial slices are as follows: Gamma (z = 1), beta (z = 45), alpha (z = −7), and theta (z = −9), from top to bottom. MEG, magnetoencephalography.
