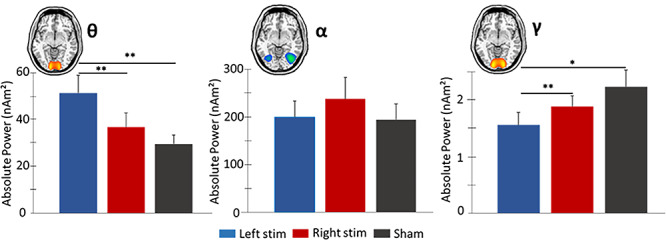
Figure 4.

Spontaneous theta, alpha, and gamma activity in occipital cortices during the baseline period. Mean absolute power (nAm2) is represented on the y-axes. Repeated measures 1 × 3 ANOVA were computed on spontaneous power averaged over the baseline period (−400 to 0 ms), with active conditions and sham collapsed across the hemispheres. (Left): Elevated theta power was observed following left versus right active and sham stimulation. (Middle): No significant differences were observed in spontaneous alpha power for the three conditions. (Right): Left active stimulation resulted in weaker spontaneous gamma power compared to right active and sham conditions. Error bars reflect the SEM. *P < 0.05. **P < 0.01. SEM, standard error of the mean.
