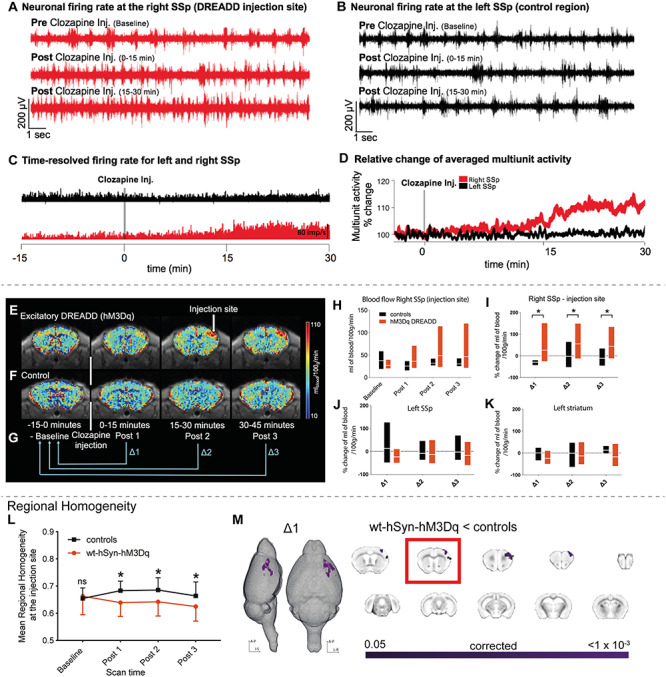
Figure 1.

Local changes in neural activity induced by activating hSyn-hM3Dq. (A) Neuronal firing rate before and after clozapine injection in the right SSp, indicating a steady increase in firing rate upon DREADD activation. (B) As A but for the left SSp (control area) indicating no change in the neuronal firing rate after clozapine injection. (C) Time-resolved firing rate in millisecond bins for the right (red) and left (black) SSp. A steady increase in firing rate occurs in the right SSp once clozapine is injected, while no change occurs in the left SSp. (D) Relative change of averaged multiunit activity recorded in the right and left SSp. (E), (F) Cerebral blood flow maps were collected every 15 min for wt-hSyn-hM3Dq and control mice (displayed in their native space), respectively. (G) Clozapine is injected 15 min after the start of the experiment. These 15 min are referred to as the baseline period (−15 to 0 min). The rest of the experiment is 45 min long and divided into three periods, that is, Post 1 (0–15 min), Post 2 (15–30 min), and Post 3 (30–45 min). For all analyses performed in this experiment (unless otherwise stated), Post data was expressed relative to baseline (Post 1/Post 2/Post 3—baseline) and is referred to as ∆1, ∆2, and ∆3, respectively. (H) Comparison of blood flow (mL of blood/100 g/min) between controls and wt-hSyn-hM3Dq mice over time (measured at the injection site). (I) Percentage change in blood flow over time between the controls (n = 7) and wt-hSyn-hM3Dq (n = 7) mice (measured at the injection site). Linear mixed models indicate a significant main groups × scan time effect (F2,21 = 5.657; P = 0.04; asterisk indicates significant between-group independent samples post hoc t-test at Post 1 (t12 = 3.23; P = 0.07), at Post 2 (t12 = 2.66; P = 0.02), and at Post 3 (t12 = 2.35; P = 0.04). (J) Percentage change in blood flow over time measured in left SSp. (K) Percentage change in blood flow over time measured in the left lateral striatum. (L) Average regional homogeneity (ReHo) change over time at the injection site. Repeated measures ANOVA (control [n = 13]; wt-hSyn-hM3Dq [n = 14]) showed a significant groups × scan time effect (F1.93,75 = 11.8; P < 0.001; asterisk indicates significant between-group independent samples post hoc t-test at Post 1 (t25 = −2.57; P = 0.01), at Post 2 (t25 = −2.28; P = 0.03), and at Post 3 (t25 = −2.1; P = 0.05). (M) Significant decrease in ReHo in wt-hSyn-hM3Dq mice versus controls for ∆1 depicted as a 3D image and in coronal slices (TFCE-corrected). The slice marked with a red rectangle shows the injectionsite.
