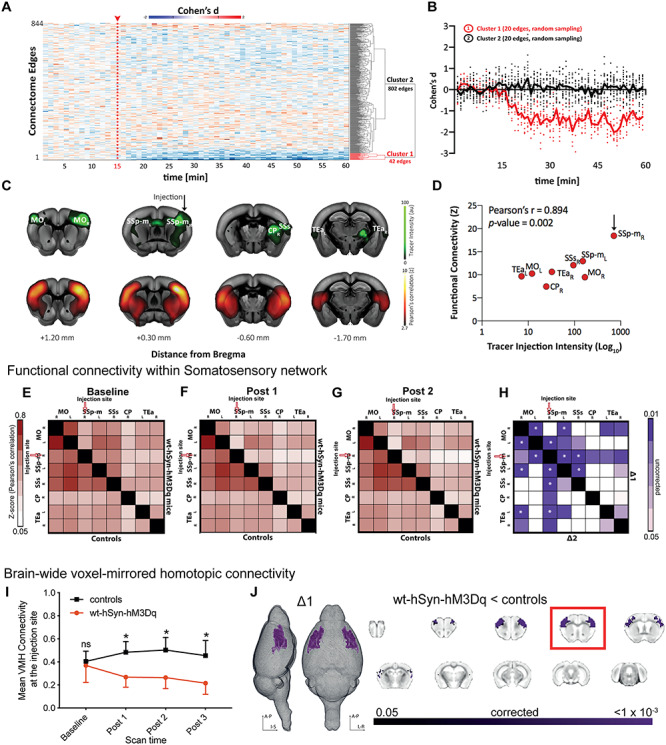
Figure 2.

Long-range connectivity changes induced by activating hSyn-hM3Dq. (A) Effect-size analysis (Cohen’s d) of functional connectivity is calculated for single edges (n = 844). Only cluster 1 shows a decrease in the effect size after clozapine injection. (B) Averaged effect size (Cohen’s d) over time for 20 edges of cluster 1 and 20 randomly selected edges of cluster 2. (C) Coronal brain slices depicting tracer data after unilateral injection in SSp (green, obtained from Allen Mouse Brain Connectivity Atlas, Injection ID: 114290938) and averaged voxel-wise Pearson’s correlation (Fisher’s z-transform) during the baseline period from a seed in the right SSp. (D) Pearson’s correlation between functional connectivity of the target region (right SSp) and tracer injection intensity obtained from images depicted in C. (E–G) Matrices represent averaged and z-transformed Pearson’s correlation of all control animals (lower triangular matrix) and all wt-hSyn-hM3Dq animals (upper triangular matrix) for the baseline period, Post 1 and Post 2, respectively. (H) The upper triangle of the matrix shows a reduction in FC in wt-hSyn-hM3Dq (n = 14) mice compared with controls (n = 13) during ∆1 (i.e., Post 1-baseline), while the lower triangle shows the same set of comparisons in ∆2 (i.e., Post 2-baseline). Color coding reflects randomized permutation testing, P < 0.05, uncorrected. Asterisks indicate significant differences that survived FDR correction for multiple comparisons. MO, somatomotor cortex; SSp-m, primary somatosensory cortex (mouth); SSs, supplementary somatosensory cortex; CP, caudoputamen; TEa, temporal association cortex; R, right; L, left. (I) Change over time of the mean brain-wide VMHC (symmetric connectivity) at the injection site. Repeated measures ANOVA (controls [n = 13]; wt-hSyn-hM3Dq [n = 14]) indicates significant groups × scan time effect (F1.67,41.9 = 21.18; P < 0.001; asterisk indicates significant between-group independent samples post hoc t-test at Post 1 (t24 = −6.01; P = 10−5), at Post 2 (t24 = −5.93; P = 10−5), and at Post 3 (t24 = −5.22; P = 10−5). (J) Significant decrease (TFCE-corrected) in symmetric connectivity depicted on 3D images and coronal slices for the ∆1 time point. The slice marked with a red rectangle is the injection slice.
