Figure 6.

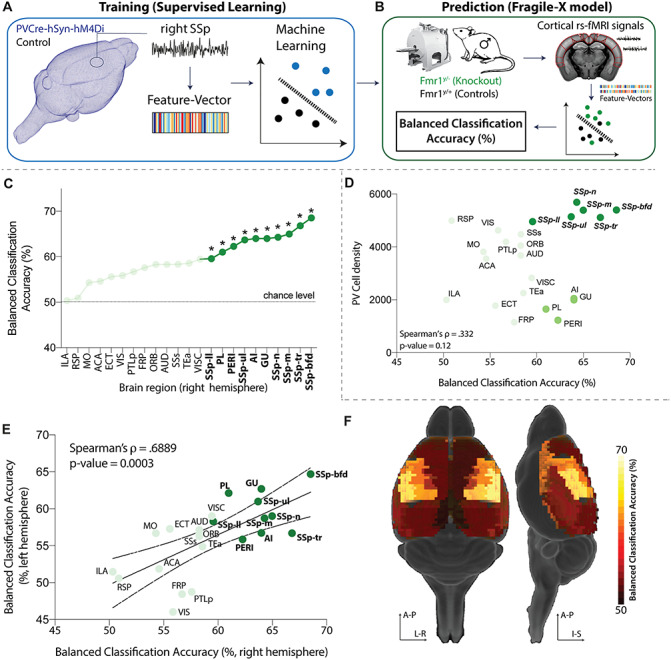
Fmr1y/− exhibit similar local BOLD dynamics as DREADD-manipulated mice. (A) The classifier was trained on features of right SSp BOLD time series to distinguish PVCre-hSyn-hM4Di from control mice. (B) The trained classifier was used to predict the identity of cortical BOLD time series measured from Fmr1y/− (knockout) and Fmr1y/+ (control) mice, identifying predictions of PVCre-hSyn-hM4Di as Fmr1y/−. Predictability in each brain region was assessed as balanced classification accuracy (%); P values were estimated using a permutation test. (C) Classification results are shown for the right hemisphere, highlighting regions with significant classification accuracy (P < 0.05, FDR-corrected) as bold, dark green, and marked with asterisks. (D) Scatter plot of balanced classification accuracy and PV cell density. (E) Balanced classification accuracy is plotted for each region in the right and left hemispheres, exhibiting a strong positive correlation, Spearman’s ρ = 0.69 (P = 3 × 10⁻⁴). (F) Balanced classification accuracy visualized on a 3D brain.
