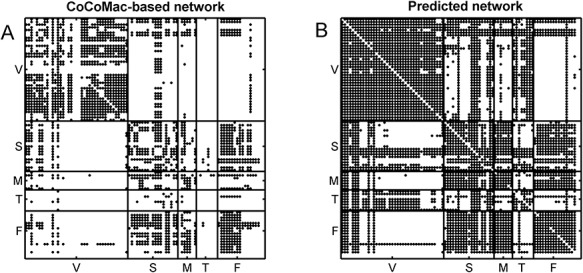
Figure 2.

Comparison of the CoCoMac-based network  across the whole hemisphere before prediction (density 26.3%) (A) and the final predicted network
  (density 59%) from the three-factor predictive model (B). Each dot shows a binary link from region i (row) to region j (column). The areas are grouped according to functional systems: V (visual), S (somatosensory), M (motor), T (temporal), and F (frontal).
