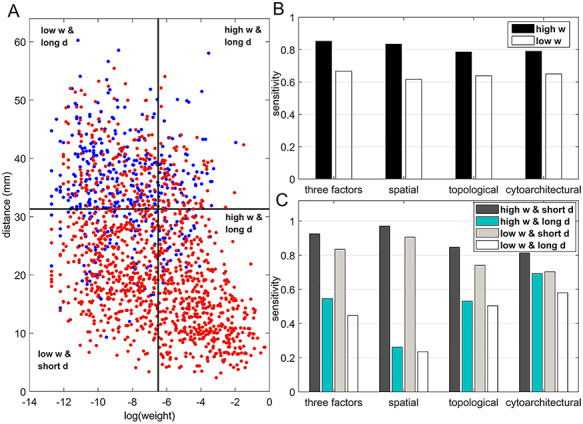
Figure 3.

Prediction performance for links with different weights and distance. (A) Four classes of links from the  experimental network
  grouped according to link weight (w) and distance (d). Dots represent all links in
  , including the existing links from CoCoMac dataset
  . Red and blue dots represent links that can be correctly predicted (TP) or cannot be predicted by a three-factor predictive model, respectively. (B) and (C) compare the sensitivity for different classes of links after applying predictive models with three factors or a single factor. (B) The sensitivity for the links with high (FLNe > 0.0015, black bars) or low (FLNe < 0.0015, white bars) experimental weights that are predicted by different models. (C) The sensitivity separately for the four classes shown in (A) by different models. Long (short)-distance links correspond to the pairs of connected regions with distances greater than 31.3 mm (less than half of the distance range).
