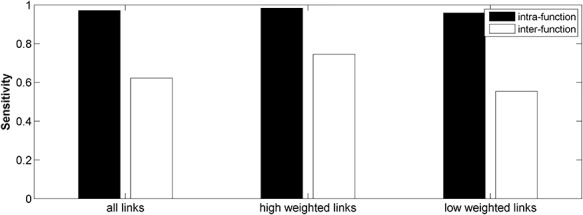
Figure 4.

Comparison of sensitivity for the intra- and interfunctional links involving all the predicted links (left group) or including only the high-weight (FLNe > 0.0015, middle group) or low-weight links (FLNe < 0.0015, right group) in the 91 29 subsystem of the predicted network
  . Here, the intra- and interfunctional links are within or between five functional domains (visual, somatosensory, motor, temporal, and frontal regions).
