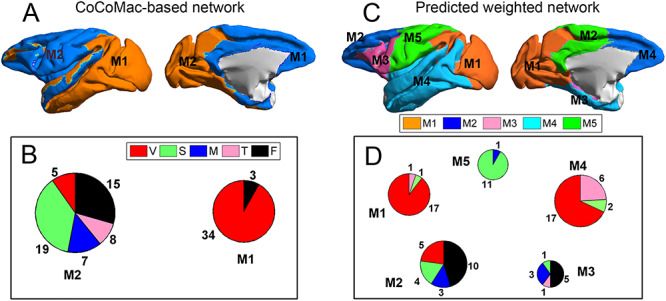
Figure 6.

Comparison between the segregation of functional modules in the CoCoMac-based binary network  (A and B) and the predicted weighted network
  (C and D). The module detection algorithm (Newman 2006) has identified two modules (M1, M2) in the CoCoMac-based network with modularity Q = 0.32, Z-score = 44.5 (A) but five modules (M1–M5) in the predicted weighted network with Q = 0.58, Z-score = 50.6 (C). For both networks, (B) and (D) correspondingly exhibit the functional domains (red: visual; green: somatosensory; blue: motor; pink: temporal; and black: frontal) for the regions in each module represented by a pie chart. The areas shown in different colors in each pie denote the numbers of regions belonging to the corresponding functional domains for each module.
