
Figure 8.
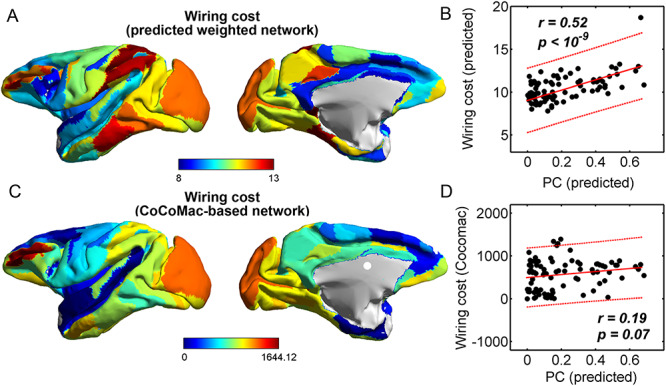
Comparison between PC and regional wiring cost in the predicted weighted network. (A) Map of wiring cost based on the predicted weighted network  . (B) Scatter plot of PCs versus regional wiring cost in the predicted network (dots). The two measures are strongly correlated (r = 0.52, P <
  ). The region prostriate has the maximal wiring cost, which is clearly larger than the others. Without considering this region, the wiring cost and PCs are still significantly correlated (r = 0.48, P <
  ). (C) Map of the regional wiring cost calculated from CoCoMac-based binary network
  . (D) Scatter plot of the PCs in the predicted weighted network versus regional wiring cost in the CoCoMac-based network, which are uncorrelated (r = 0.19, P = 0.07).