
Figure 1.
The precision and weight recovery rate by the predictive model. The predicted network in the 91  29 subsystem is compared with the corresponding high-resolution
  experimental network
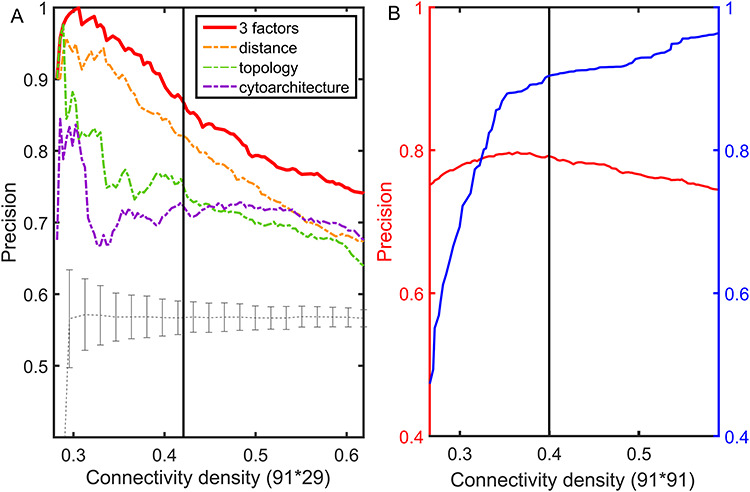
  . (A) The precision (correctness of predicted links) in the predicted network based on different predictive models (three factors vs. single factor) with respect to connectivity density for the 91
  29 subsystem. The gray dashed line is a random benchmark (including error bars from 5000 independent realizations of randomly adding links). (B) The precision (red line) and the weight recovery rate (
 , blue line) of the predicted network after combining with the initial CoCoMac-based network
  , versus the overall connectivity density in the whole 91
  91 network. In both subplots, the black vertical line indicates the overall connectivity density of the
  network at 40%.