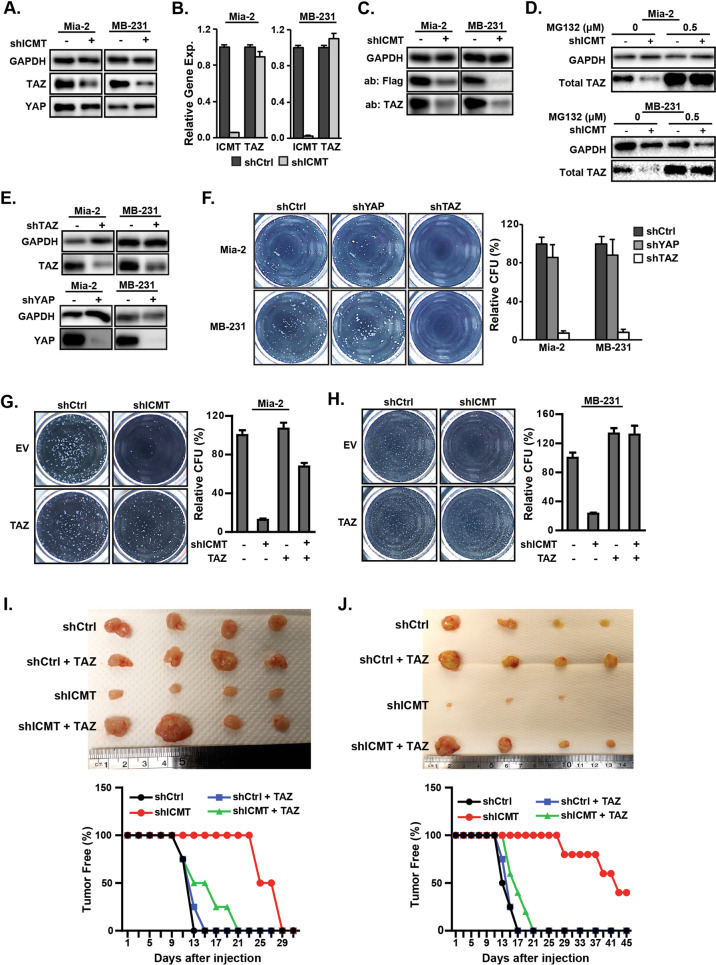
Fig. 3. ICMT regulates cancer cell self-renewal/stemness via the control of TAZ protein level.
Suppression of ICMT reduces the TAZ protein (a), but not transcript (b) levels in MiaPaCa2 and MDA-MB231 cells. a The levels of TAZ and YAP proteins were assessed by immunoblot analysis. b RT-qPCR analysis for the relative gene expression levels of TAZ and ICMT. c Immunoblot analysis for both endogenous TAZ and the introduced Flag-tagged TAZ protein levels in MiaPaCa2 and MDA-MB231 cells in the presence or absence of ICMT knockdown. d Immunoblot analysis of TAZ protein levels in MiaPaCa2 (top) and MDA-MB231 (bottom) cells, with or without ICMT knockdown, following 24 h of treatment with the indicated concentrations of MG132, a proteasome inhibitor, or vehicle control. e Immunoblot analysis showing shRNA knockdown of TAZ (top) and YAP (bottom) in MiaPaCa2 and MDA-MB231 cells. f Impact of TAZ and YAP knockdown on sphere forming ability. Left: images from the third replating of cells expressing control or TAZ-targeting shRNA; right: quantification of the sphere numbers using OpenCFU and Prism. The data presented are from the analysis of three technical repeats of the same study, which was repeated three times with similar findings. g, h Ectopic expression of TAZ rescues the sphere formation ability of MiaPaCa2 and MDA-MB231 cells. g MiaPaCa2 cells expressing TAZ or control vector were infected with lentivirus coding either control shRNA or ICMT shRNA; the cells were then seeded for the sphere formation assay. Left: images of spheres formed after growth of the 3rd plating; right: bar graph presenting the quantification of sphere numbers from three technical repeats of the study. h The TAZ rescue studies as in g were performed on MDA-MB231 cells. All in vitro studies in a–g were repeated three times with similar results. Tumor formation abilities were studied on the same MiaPaCa2 (i) and MDA-MB231 (j) cells similarly prepared as in g and h, respectively. For each study, 80,000 cells were injected subcutaneously into NOD-SCID mice; n = 10 tumors for each condition. Tumor formation was monitored through the course of the study until the control tumors reached the size limit set by IACUC protocol, whereupon the mice were euthanized and tumors excised. The top of both panels show the images of the excised tumors from the respective groups; in the bottom panels the percentage of tumor-free mice through the course of the study are plotted.

