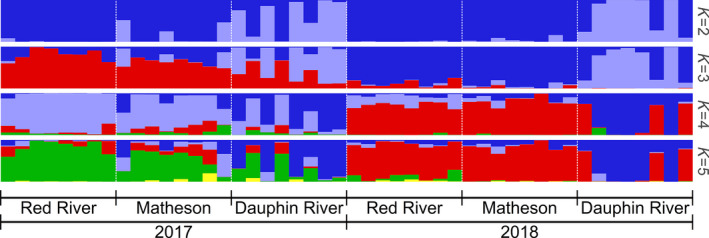
Figure 2.

Representative Structure runs from ten replicates testing K = 2–5, organized by collection site (Red River in the south basin, Matheson Island in the channel, and Dauphin River in the north basin) and year collected (2017 and 2018) for all walleye (Sander vitreus) used in the present study. Collection site locations are available in Figure 1. This analysis was performed with 52,372 Hardy–Weinberg equilibrium filtered and linkage disequilibrium pruned, putatively neutral single nucleotide polymorphisms
