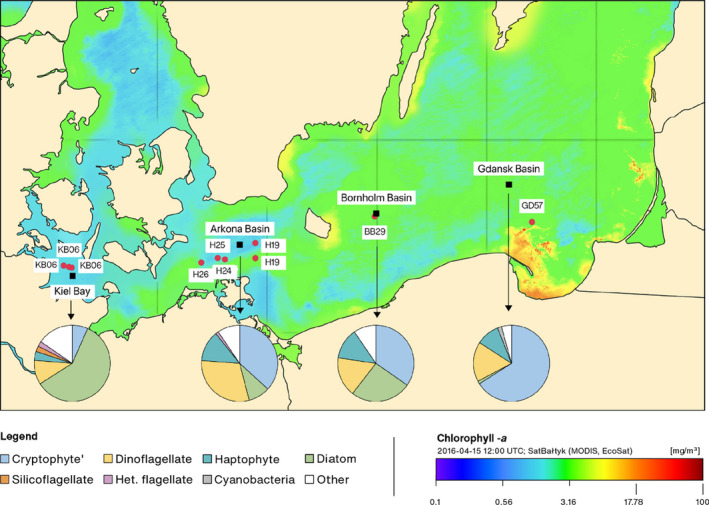
FIGURE 1.

Sampling stations in the Baltic Sea for the AL476 cruise (fauna; filled red circles) and black filled squares for the IOW stations (phytoplankton monitoring; Wasmund et al., 2017). The color gradient on the map shows showing surface concentration of the chlorophyll‐a on 15 April 2016 observed by satellite and supplemented by the results of the ecohydrodynamic model EcoSat (http://satbaltyk.iopan.gda.pl ). The four pie charts present the relative biomass fraction of major taxonomic algal groups integrating monitoring results from three cruises from January to May 2016 (Wasmund et al., 2017). “Het.” is an abbreviation for heterotrophic
