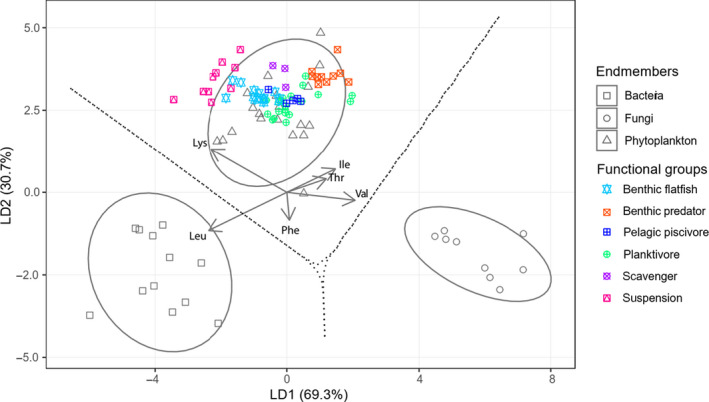
FIGURE 2.

Linear discriminant function analysis based on δ13CEAA values of training data comprising of bacteria, fungi and marine phytoplankton (Larsen et al., 2013) and consumers from this study. The phytoplankton comprise of eight diatom samples (D1‐D5; N1‐N3), four chrysophytes (X1‐X4), four haptophytes (H1 – H4), two chlorophytes (K1 & K2), and one cryptophyte (Y1)— see Larsen et al. (2013) for sample codes. The ellipses represent 95% confidence intervals of each endmember, and the arrows represent the relative weightings of the independent variables for creating the discriminant function. Amino acid abbreviations: isoleucine (Ile), leucine (Leu), lysine (Lys), phenylalanine (Phe), threonine (Thr), and valine (Val)
