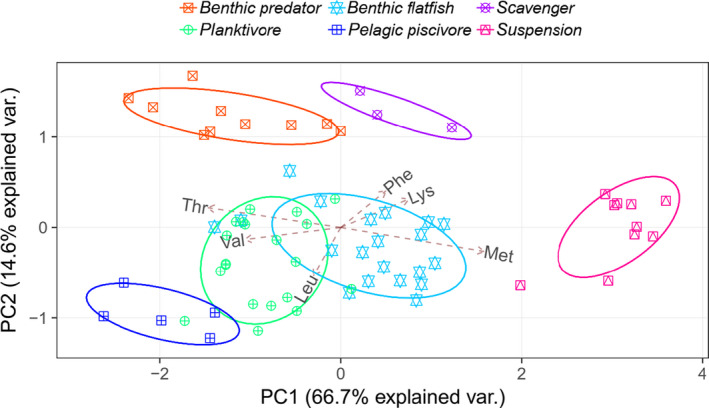
FIGURE 3.

Principal component analysis for functional groups using mean‐centered δ13CEAA values of consumers from Kiel Bay and Arkona Basin. Values in parentheses are the percentage variations accounted by each axis. The two axes account for 82% of the variations. The ellipses signify 95% confidence boundaries for each group. Amino acid abbreviations: leucine (Leu), lysine (Lys), methionine (Met), phenylalanine (Phe), threonine (Thr), and valine (Val)
