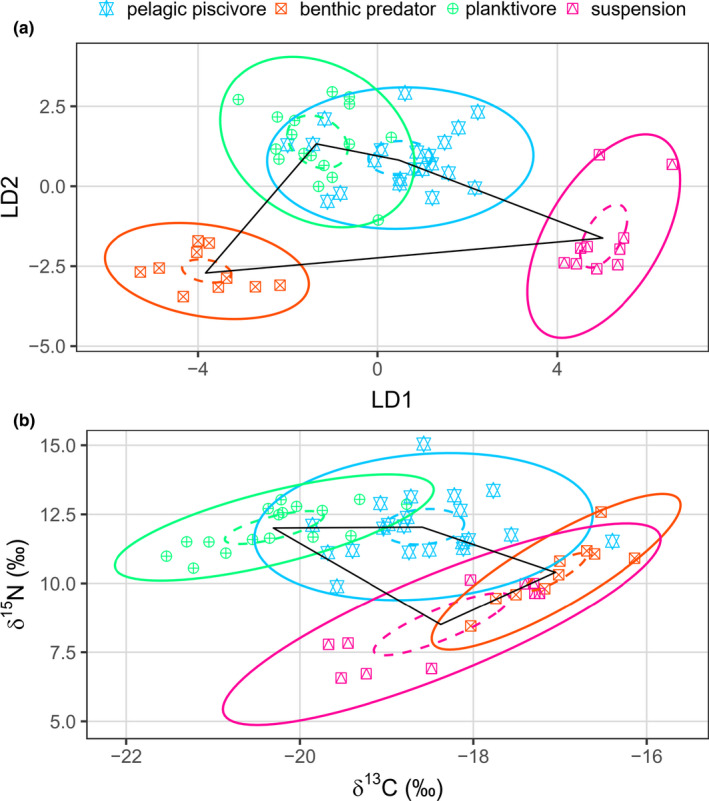
FIGURE 6.

Niche spaces of Kiel Bay and Arkona Basin functional groups based on multivariate δ13CEAA (a) and bivariate bulk isotope (b; δ13Clipid corrected and δ15N) values. To represent the δ13CEAA data in a bivariate space (see Figure 3 for the independent variables), we used the first two linear discriminant scores encompassing 97.8% of the variability. The groups depicted here contain ≥10 specimens. The niche spaces are visualized by 95% confidence interval around the bivariate means, also called the standard ellipse area (SEA; inner ellipses with broken lines) and 95% prediction ellipses (outer ellipses with full lines), respectively. The convex hulls encompassing the group means are denoted TAc for the total area of each community. The community niche space is generally more separated for δ13CEAA than bulk isotopes; for example, there is only one overlap of the prediction ellipses between functional groups in the δ13CEAA biplot, but four overlaps in the bulk biplot
