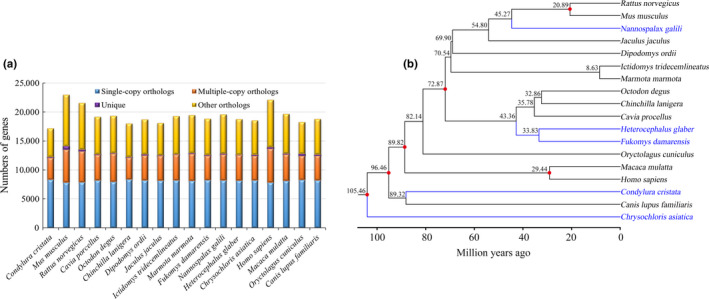
FIGURE 1.

(a) Distribution of orthologous genes in different mammals. “Single‐copy orthologs” represents a single‐copy gene family; “Multiple‐copy orthologs” represents multiple‐copy gene families; “Unique orthologs” indicates genes specific to the corresponding species; and “Other orthologs” indicates genes other than those in the above categories. (b) Genome‐wide phylogenetic tree of 18 mammalian species. The number of nodes represents the estimated divergence time, and six red nodes are supported by fossil data. The bootstrap support rate for all nodes is 100
