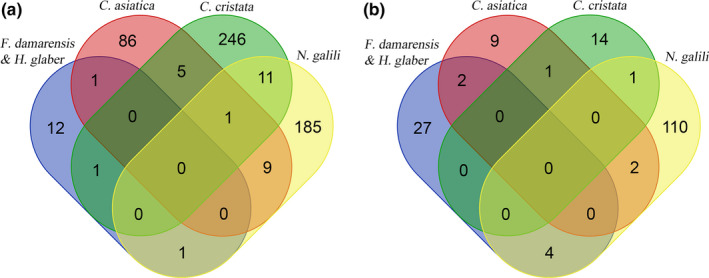
FIGURE 3.

(a) Venn diagram of the number of positive selection genes in the four branches of subterranean mammals. (b) Venn diagram of the number of expanded gene families in the four branches of subterranean mammals

(a) Venn diagram of the number of positive selection genes in the four branches of subterranean mammals. (b) Venn diagram of the number of expanded gene families in the four branches of subterranean mammals