
FIGURE 4.
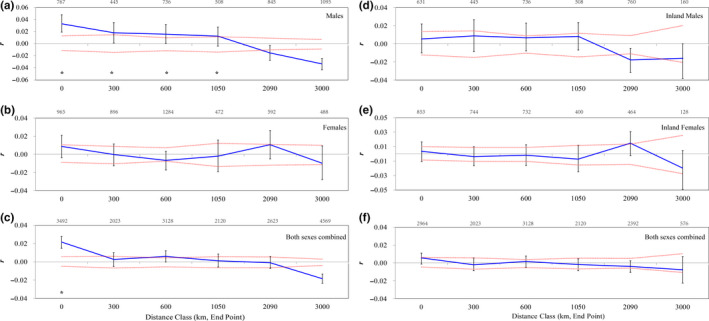
Spatial autocorrelograms for Swan Geese Anser cygnoides based on localities that are approximately equidistant (AIL, UGI, GUR, CHU, HUL, and HR; see Figure 2 for details) including (a‐c) or excluding (d‐f) the coastal group (FER). The autocorrelation coefficient (r, the blue solid lines) for (a, d) males (n = 98 and 81, respectively), (b, e) females (n = 98 and 82, respectively), and (c, f) both sexes combined dataset (n = 196 and 163, respectively) is plotted for six gradual increasing geographical distance classes. Sample sizes for each distance class are presented above each panel. The red dotted lines represent the 95% upper and lower confidence intervals of r. Significant spatial structure is marked with asterisks when r exceeds the null distribution and the error bars do not overlap zero