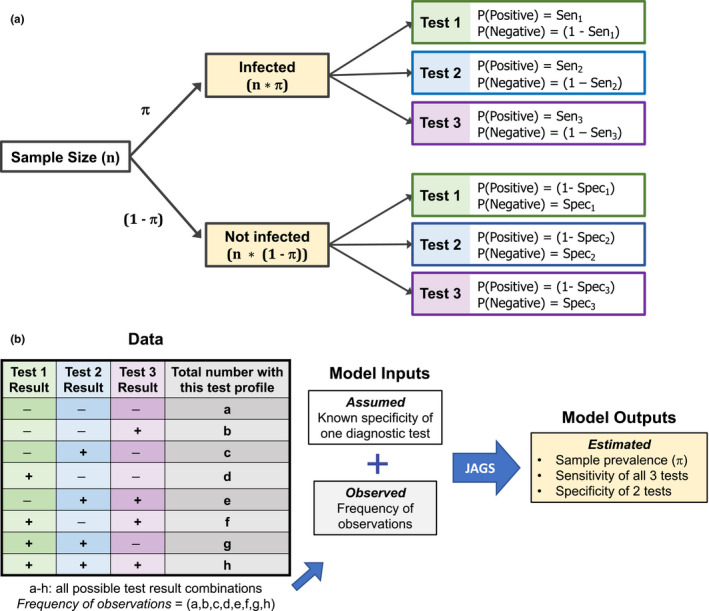
FIGURE 2.

Possible infection categories and test results for a sample population (a), and the workflow for assessment in Bayesian latent class analysis (b). (a) The relationship between sample size, prevalence, and the probability of a positive or negative result for three different diagnostic tests. For infected individuals, the probability of a given test result is proportional to the sensitivity (Se) of that test (top right). For uninfected individuals, the probability of a given test result is proportional to the specificity (Sp) of that test (bottom right). (b) Workflow diagram for Bayesian latent class analysis, taking results from data along with the fixed specificity of one test to obtain posterior probability estimates for all unknown (latent) parameters
