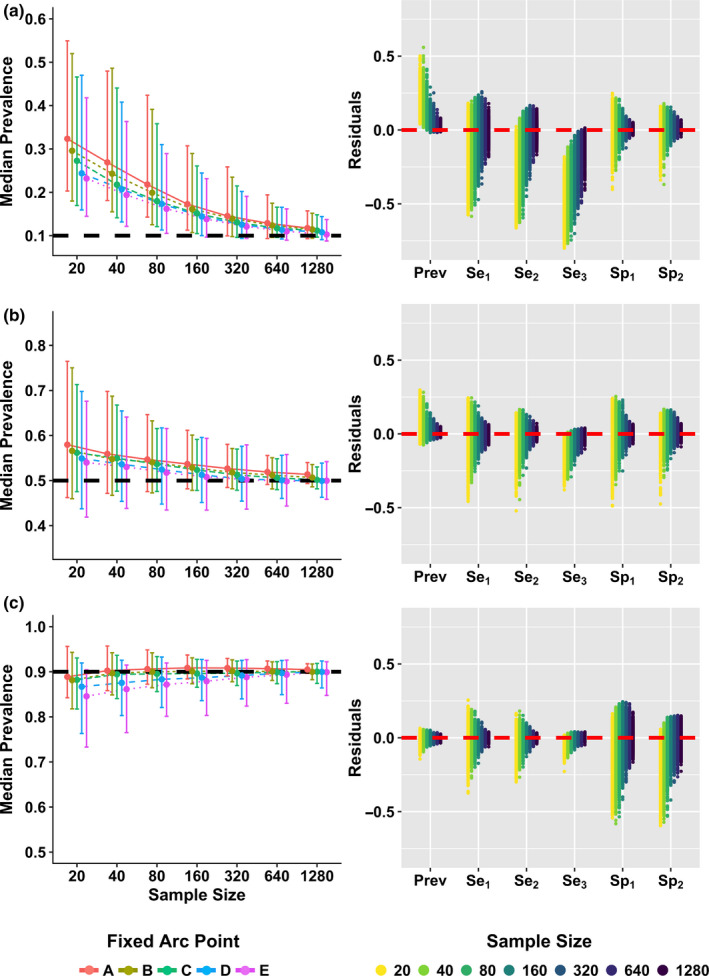
FIGURE 3.

Parameter estimates at three true prevalence levels (10%, 50%, and 90%). Left: Median prevalence estimates and 95% credible intervals (CrI) are shown for points A‐E at a true prevalence of 10% (a), 50% (b), and 90% (c), with true prevalence shown as dashed black lines (y‐axes scaled equally). Right: Residuals for all parameter estimates (prevalence, sensitivities for tests 1–3, specificities for tests 1 and 2) using simulated samples (n = 1,000) generated with fixed arc point C (test 3 fixed Se = 95% and Sp = 95%), with zero shown as dashed red line
