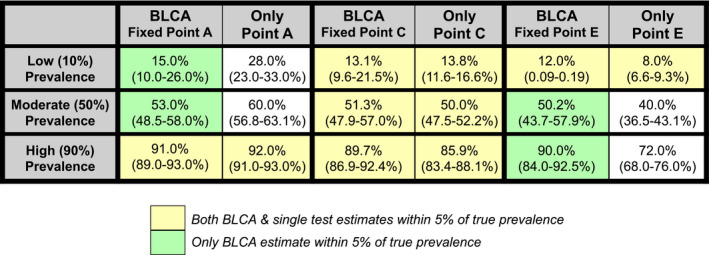
TABLE 2.
Comparison of prevalence estimates from BLCA versus a single test (sample size, n = 320)

Both BLCA and single test estimates within 5% of true prevalence. Only BLCA estimate within 5% of true prevalence. The BLCA estimates were obtained using the original test 1 (Se1 = 70%/Sp1 = 70%) and test 2 (Se2 = 80%/Sp2 = 80%) settings, along with point A (left; Se3 = 100%/Sp3 = 80%), point C (middle; Se3 = 95%/Sp3 = 95%), or point E (right; Se3 = 80%/Sp3 = 100%). Single test estimates and 95% CI were obtained using 1,000 Bernoulli trials weighted by the test Se/Sp for test A, C, or E alone. Scenarios where both BLCA and single test estimates were within 5% of the true value are shown in yellow, while scenarios where BLCA alone was within 5% of the true prevalence are shown in green.
