FIGURE 3.

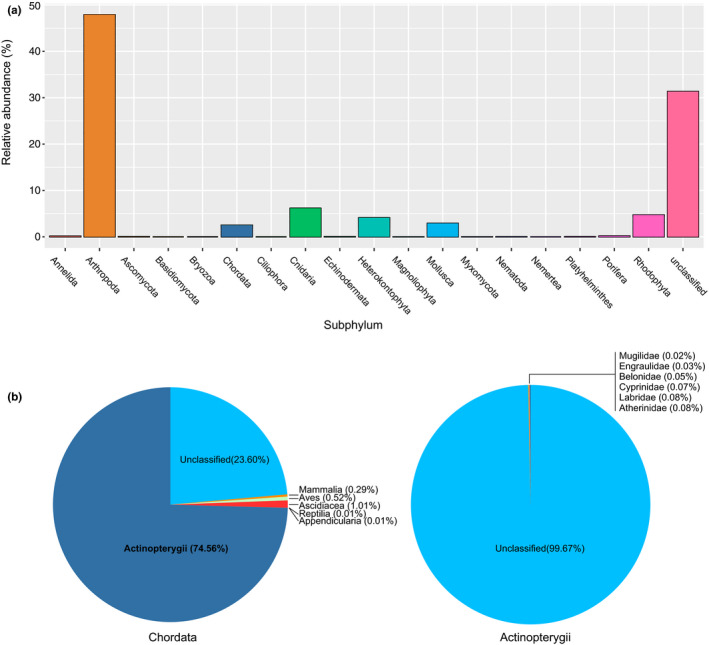
(a) Relative read abundance (%) of taxa classified to Subphylum, and (b) specifically classes within Chordata and families within Actinopterygii, respectively, from the four samples sequenced with the “mlCOI” primers

(a) Relative read abundance (%) of taxa classified to Subphylum, and (b) specifically classes within Chordata and families within Actinopterygii, respectively, from the four samples sequenced with the “mlCOI” primers