FIGURE 6.

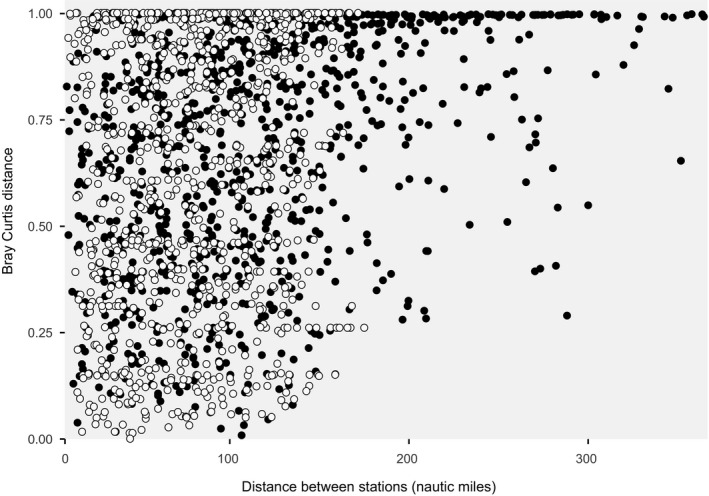
Scatterplot showing the overall relationship between Bray–Curtis distance and geographic distance between pairs of eDNA (black) and trawling (white) stations

Scatterplot showing the overall relationship between Bray–Curtis distance and geographic distance between pairs of eDNA (black) and trawling (white) stations