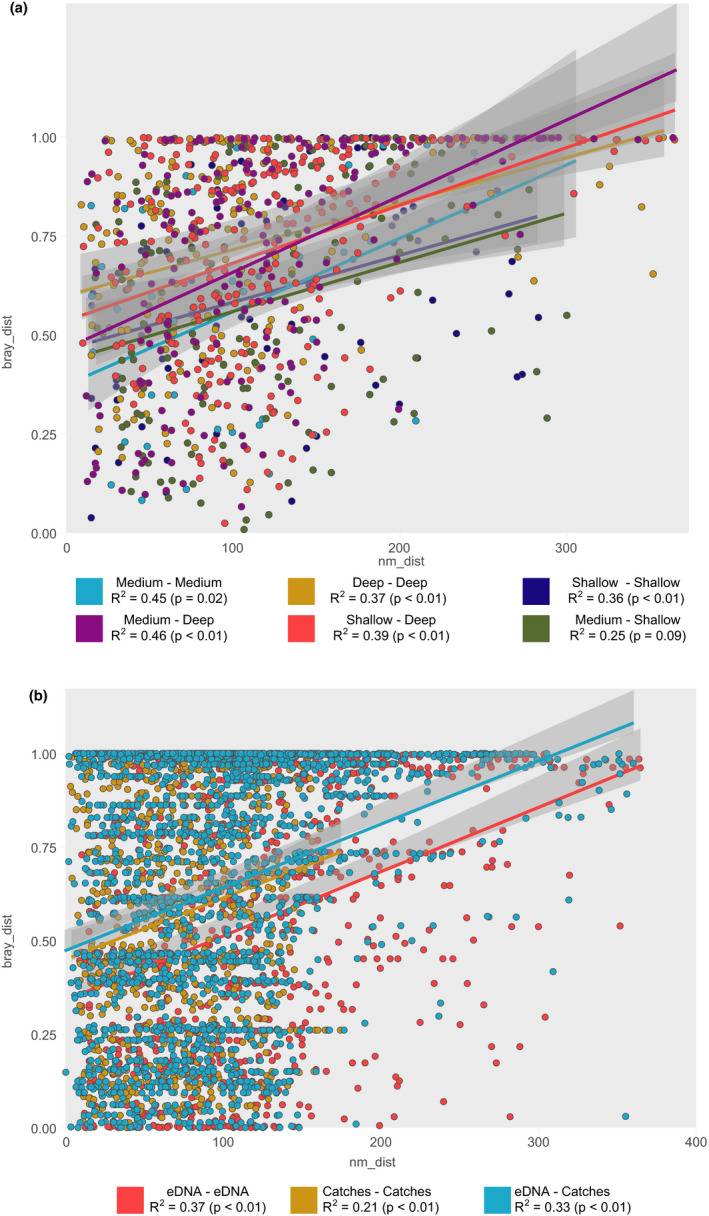
FIGURE 7.

Scatterplot showing the relationship between Bray–Curtis distance and geographic distance between pairs of sampling points for (a) eDNA, (b) trawling, and (c) eDNA and trawling stations combined. Species included in c are only the common species detected by the two sampling methods. Pearson correlation is shown for each data group. Shaded area represents the 95% confidence interval of the linear regression
