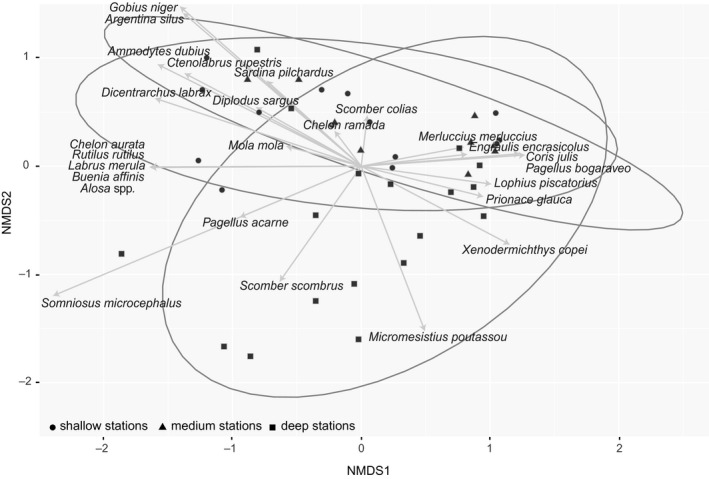
FIGURE 8.

Nonmetric multidimensional scaling (NMDS) plot, with a stress of 0.15, showing the similarity of species from each sample based on their relative abundance. The ellipse shows the 95% distance based on the centroid of the three sampling zones groups (shallow, medium, and deep stations). Spatial patterns of the species with >1,000 reads are shown
