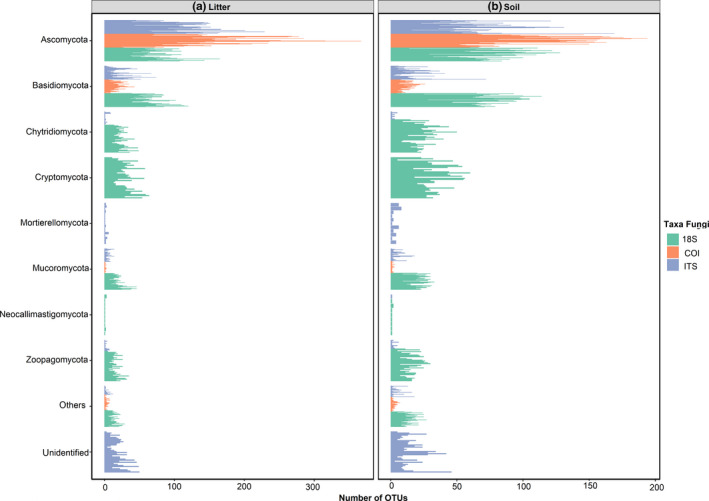
FIGURE 2.

Number of OTUs by fungal phylum. Each bar is the number of OTUs in each plot in (a) litter samples and (b) soil samples. The colors represent the different molecular markers sequenced for this study. All datasets are dominated by Ascomycota, followed by Basidiomycota
