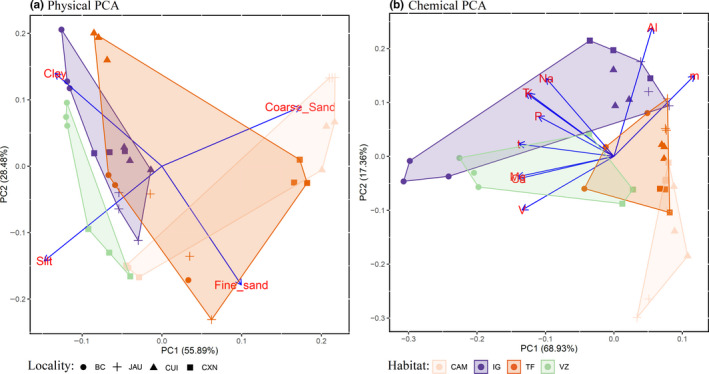
FIGURE 3.

Physical and chemical soil similarity of sample sites across Amazonia. The figure shows the study sites colored by habitat type on the first two axes of a principle component analysis for (a) physical properties (silt, clay, and sand categorized in fine and coarse fractions) and (b) chemical proprieties: phosphorus (P), exchangeable bases (Na, K, Ca, and Mg), exchangeable aluminum (Al), saturation index by aluminum (m), base saturation index (V), effective cation exchange capacity (t), and cation exchange capacity (T). The symbols represent the localities, in the west‐to‐east order: Benjamin Constant (BC), Jaú (JAU), Cuieras (CUI), and Caxiuanã (CXN). The blue rows show the values of each variable's loading in the two first PC axes. For the physical PCA, we found that flooded forests (igapós and várzeas) are associated more fine soil texture (silt and clay), with a wider spread of terra‐firme and campinas. For the chemical PCA, the positive end of the first PC axis, which represents low‐fertility soils, is occupied by a campinas group, followed by terra‐firmes
