
FIGURE 5.
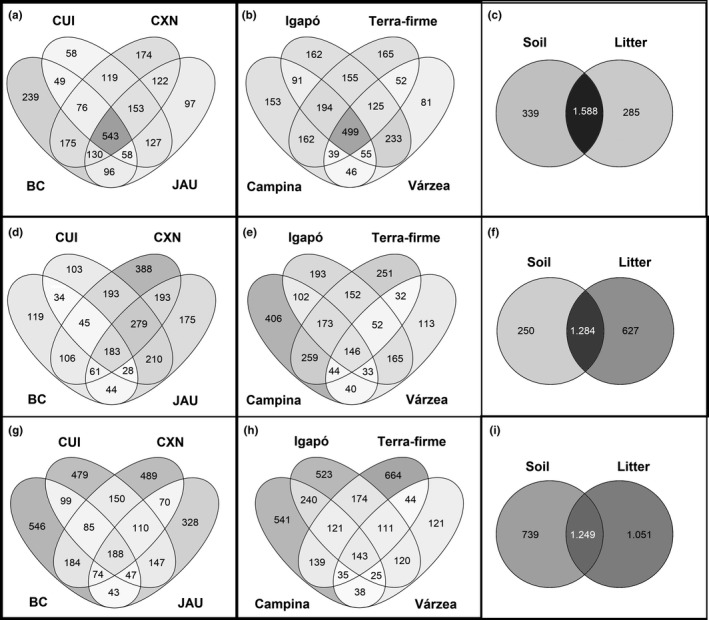
Venn diagrams showing the number of exclusive and shared OTUs for localities (a), habitats (b), and sample type (c) in the 18S dataset; for localities (d), habitats (e), and sample type (f) in the COI dataset; and for localities (g), habitats (h), and sample type (i) in the ITS dataset