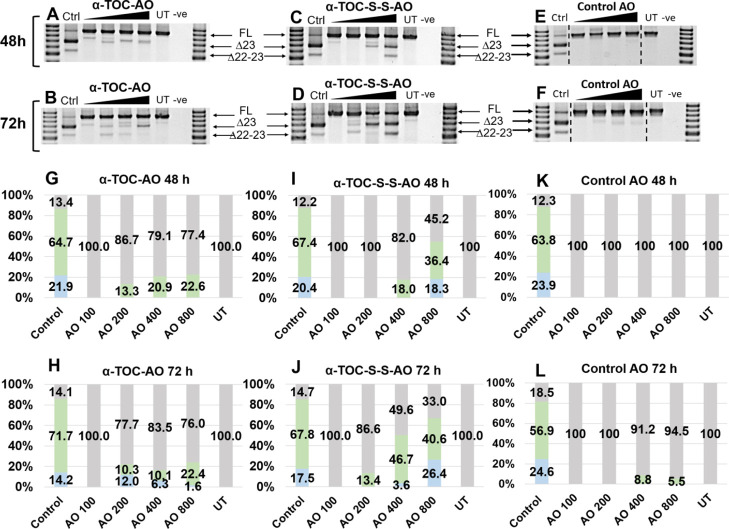
Figure 2.
RT-PCR analysis and transcript densitometry analysis of RNA prepared from H2K mdx mouse myotubes transfected with AOs; (A,G) α-TOC AO for 48 h of incubation; (B,H) α-TOC AO for 72 h of incubation; (C,I) α-TOC-S-S-AO for 48 h; (D,J) α-TOC-S-S-AO for 72 h; (E,K) control AO for 48 h of incubation; (F,L) control AO for 72 h of incubation. The triangles above the gel image indicate the increasing AO concentration (100, 200, 400, and 800 nM); FL (full length) = 901 bp, Δ23 (exon 23 skipped) = 688 bp, Δ22–23 (exons-22 + 23 skipped) = 542 bp, Ctrl = control AO transfected with Lipofectin at 100 nM, UT = untreated, and −ve = negative control. Green = exon 23 skipped, blue = exon 22–23 skipped, and gray = full length.

