
Figure 13.
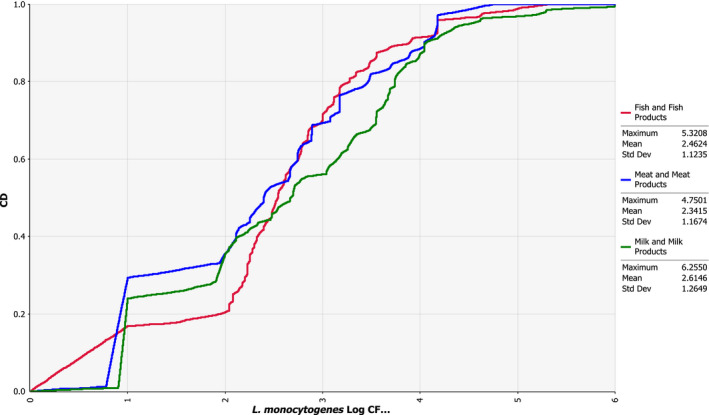
Empirical cumulative distribution function of the reported Listeria monocytogenes concentration in RASFF notifications (2008–2016) for ‘fish and fish products’ (N = 130), ‘milk and milk products’ (N = 126) and ‘meat and meat products other than poultry’ (N = 81)
- The empirical cumulative distribution function is a step function that jumps up by 1/n at each of the n data points. Its value at any specified value of the measured variable is the fraction of observations of the measured variable that are less than or equal to the specified value. Example: the red curve shows that concentration has a probability of 20% to be less or equal to 2 log10 CFU/g.